The New Soli Dev Bar
The best debugging tools do not ask you to leave the page you are working on.
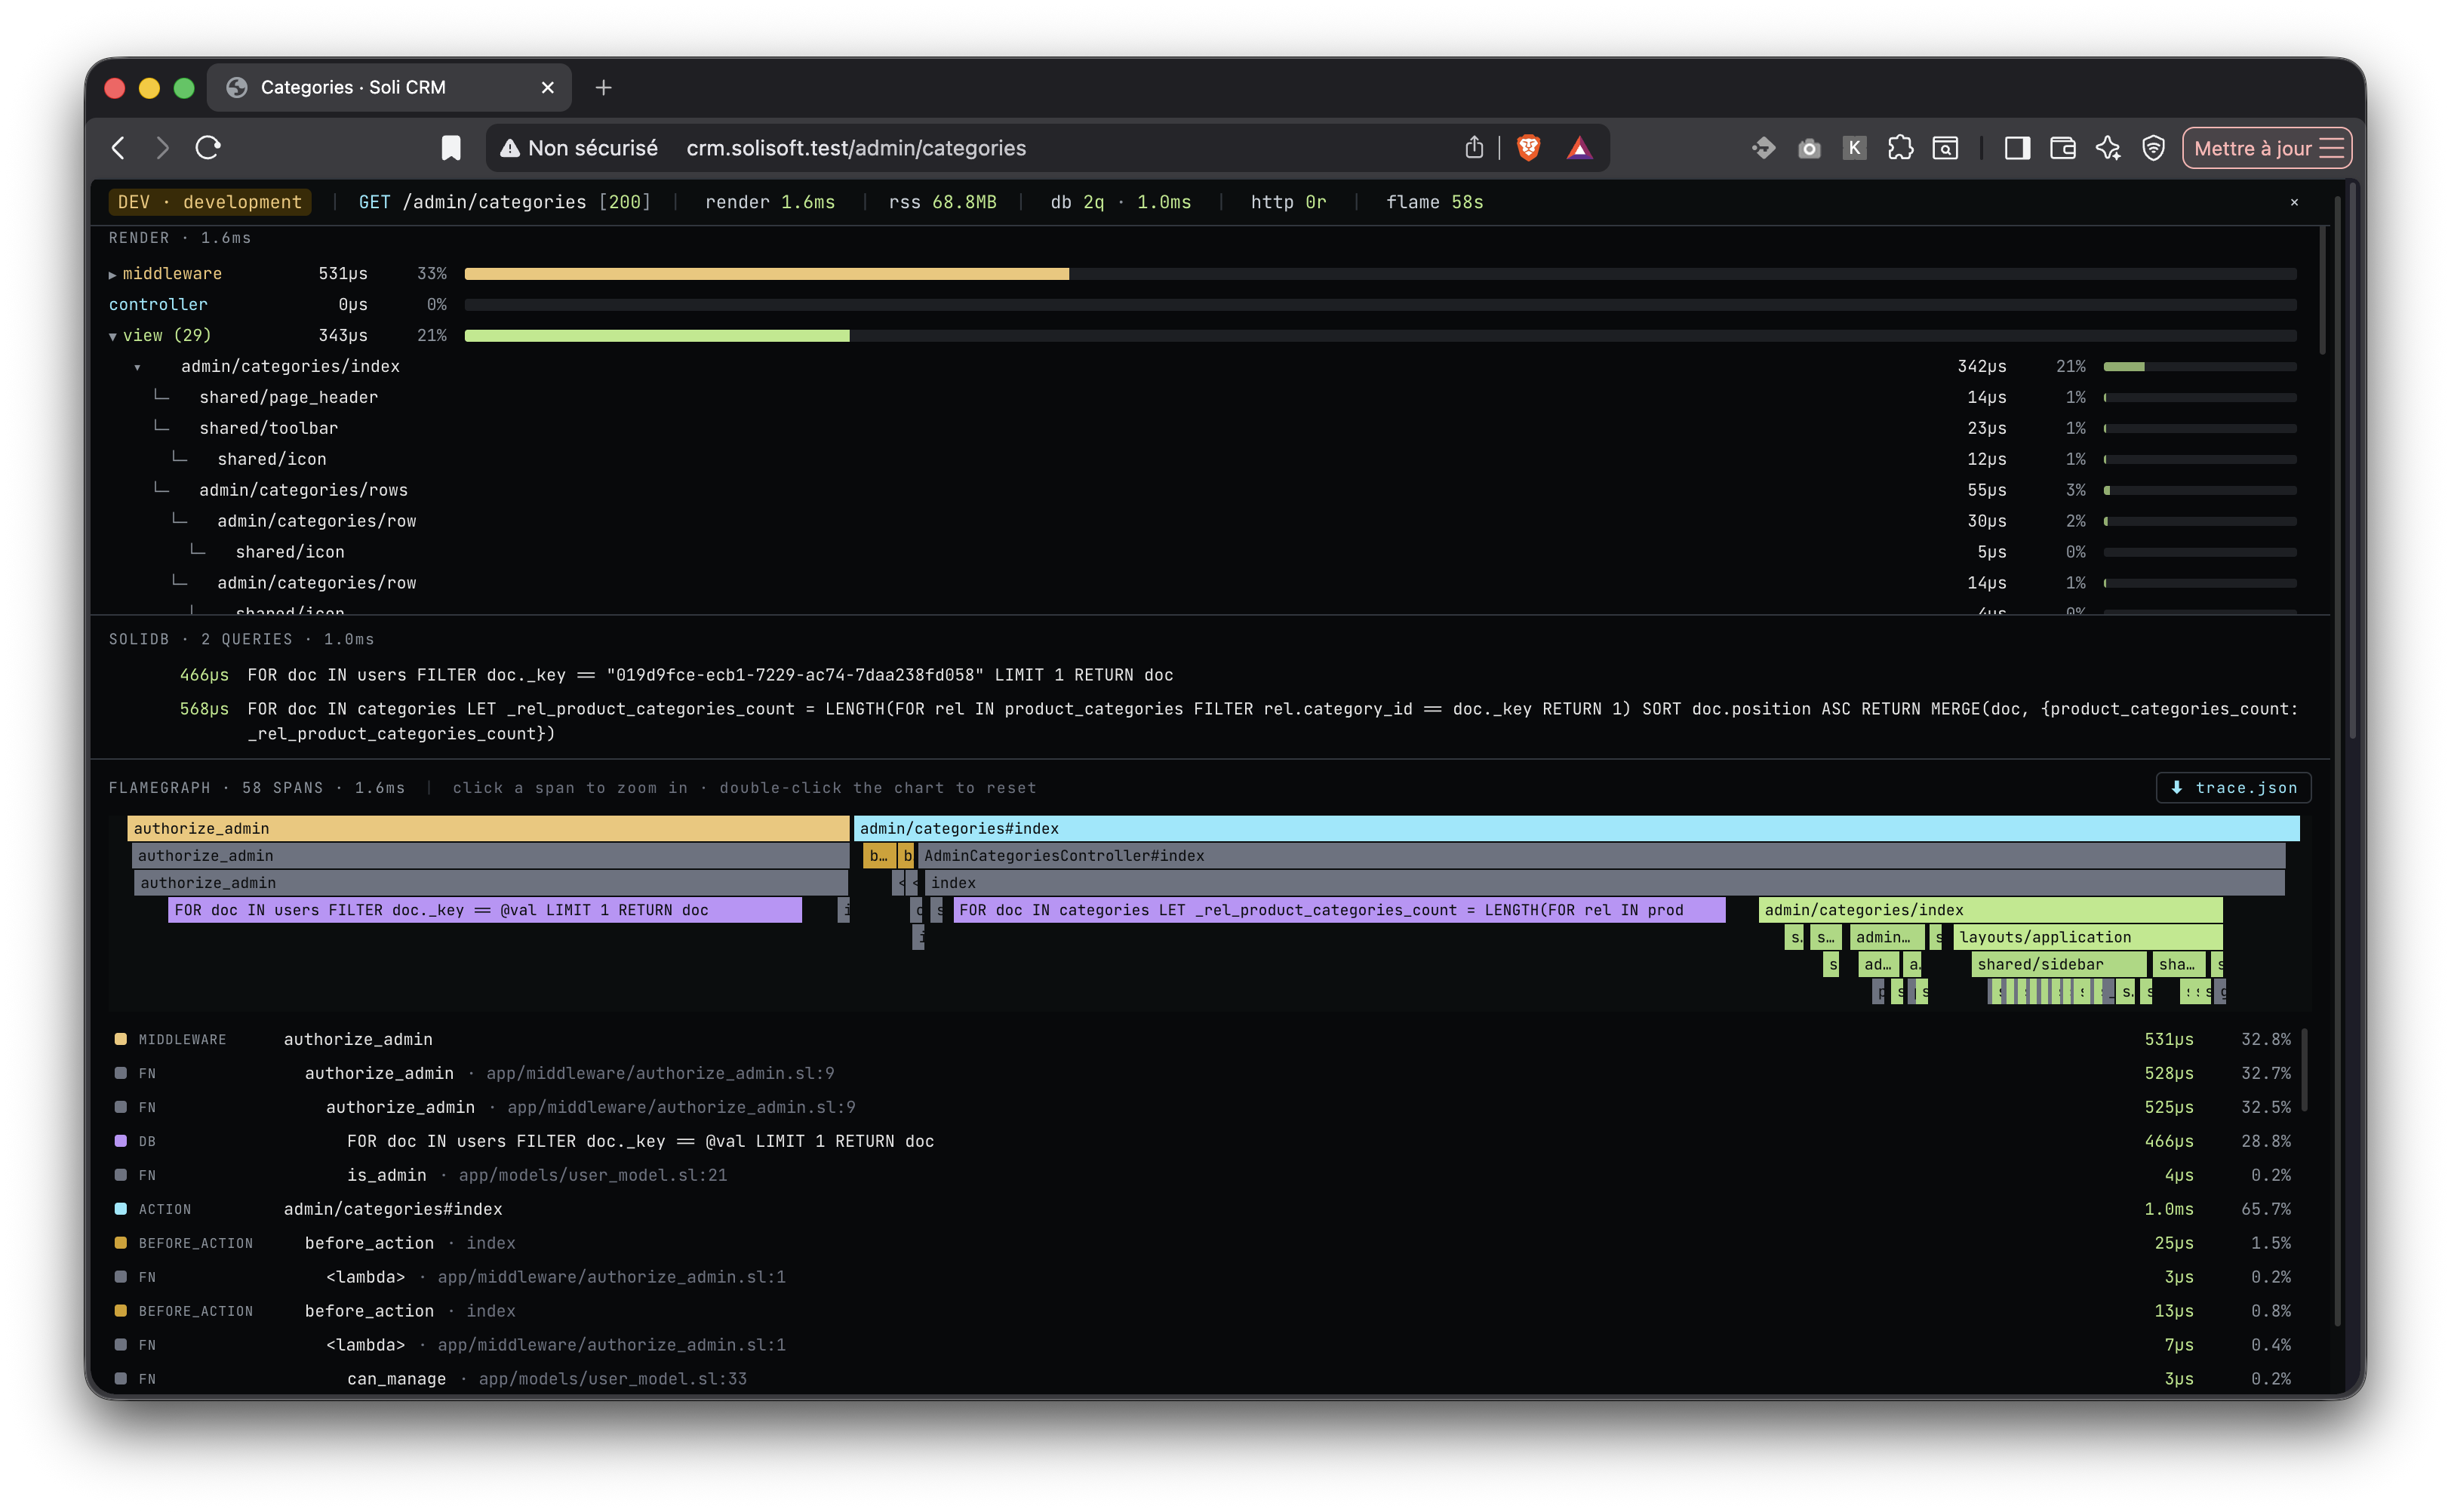
When a Soli app runs in development mode, every HTML response can now carry a small dev bar at the bottom of the browser. It shows the request, the response status, total render time, resident memory, database work, outgoing HTTP calls, and a flamegraph of the whole request. No template changes. No app-level setup. Start the server with --dev, load a page, and the instrumentation is there.
This is the kind of tool that makes a framework feel alive while you build with it.
A Request, Not a Guess
Server-side web apps are often debugged from the outside in. A page feels slow, so you open the terminal, add a print, reload, inspect logs, add another print, reload again, and slowly build a mental model of what happened.
The dev bar starts from a different premise: the request already knows what happened. Soli should show it.
At a glance, the bar gives you:
- The current environment, method, path, and status code
- Total request/render time
- Worker RSS memory
- SolidB query count and total query time
- Outgoing HTTP request count and total time
- A per-request flamegraph
Those numbers are deliberately small and close to the page. You can keep working in the browser, click into detail only when something looks suspicious, and hide the bar with Alt+D when it gets in the way.
The Render Breakdown
Click render and Soli breaks the request into the phases that actually shaped the response:
middleware
controller
view
db
http
Middleware can expand into individual middleware calls. Views can expand into the layout, top-level view, and partials that rendered the page. The view tree preserves parent/child relationships, so a slow partial does not disappear inside a single "template time" number.
This matters because "the request took 80 ms" is not actionable. "The layout rendered quickly, but one partial inside a loop took most of the page time" is.
The dev bar also pairs rendered templates with the page itself. Hover a view row and Soli outlines the matching rendered region in the browser. That makes it much easier to answer the question every MVC developer has asked at least once: "which template produced this piece of HTML?"
Database Queries Where You Need Them
The db panel shows every SolidB query executed through the model layer during the current request, including duration and bind variables. Instead of switching to logs and reconstructing which request emitted which query, the query list lives next to the page that caused it.
The bar also flags likely N+1 patterns. If the same query template fires repeatedly in one request, Soli highlights it and suggests the shape of the fix: batch the lookup with an IN filter instead of asking the database once per parent row.
That is the kind of feedback that is most useful while the code is still fresh in your head. You see the repeated query, click back to the controller or view, and fix the data shape before it becomes production behavior.
Outgoing HTTP Calls Count Too
Slow requests are not always slow because of the database. They can wait on an API, an auth provider, a payment service, or any other network dependency.
The dev bar tracks outgoing HTTP calls made through Soli's HTTP helpers. The http panel shows method, URL, status or error, and duration. If a page is fast locally until it calls another service, the bar makes that visible in the same request timeline.
A Flamegraph in the Browser
Click flame and the dev bar opens a hierarchical flamegraph for the current request. It captures:
- Request time
- Middleware
- Before and after actions
- Controller action dispatch
- Views, layouts, and partials
- Soli function calls
- Database spans
- Outgoing HTTP spans
Hover a span to see the exact duration and metadata. Click a rectangle to zoom into that part of the request. Double-click the chart to reset.
The flamegraph is not just a visualization of framework phases. It includes user code too, so a wide controller or function span tells you where to look next. The goal is not to turn every developer into a profiler expert. The goal is to make the hot path obvious enough that you can keep building.
Export When the Browser View Is Not Enough
For deeper analysis, the flame panel includes a trace.json download. The file uses Chrome Trace Event Format, so you can open it in Perfetto or chrome://tracing.
That gives you the lightweight browser workflow first, with a real profiler escape hatch when a request deserves more careful inspection.
Why It Is Built Into Soli
Soli is both a language and a framework, which gives it a useful advantage: the runtime, router, model layer, template renderer, HTTP helpers, and development server can agree on one request-local view of the world.
The dev bar uses that integration instead of asking each app to wire its own debugging stack. The server records spans. The model layer records queries. The template engine records render boundaries. The response injector adds a self-contained bar to HTML responses in development mode.
Because it is built in, new Soli apps get the tool automatically. Because it is development-only, production keeps the instrumentation out of the response path.
The injector also recognises HTMx swap traffic: requests that arrive with the HX-Request: true header are partial fragments destined for a page that already carries the dev bar, so Soli skips injection on those responses. Without this gate, every HTMx swap would append a fresh bar into the live DOM and you would quickly see a stack of dev bars at the bottom of the page.
Small Tools Change How You Work
The dev bar is not a replacement for logs, breakpoints, tests, or production observability. It is the fast feedback layer between "I changed the page" and "I understand what the page did."
That layer matters. It makes performance visible before it becomes a crisis. It makes template structure visible before it becomes folklore. It makes database behavior visible while the feature is still being written.
Most importantly, it keeps the debugging loop where the work is already happening: inside the browser, attached to the page you just built.